A straightforward field guide for analysts who need a confident answer from an infrared spectrum in the first ten minutes.
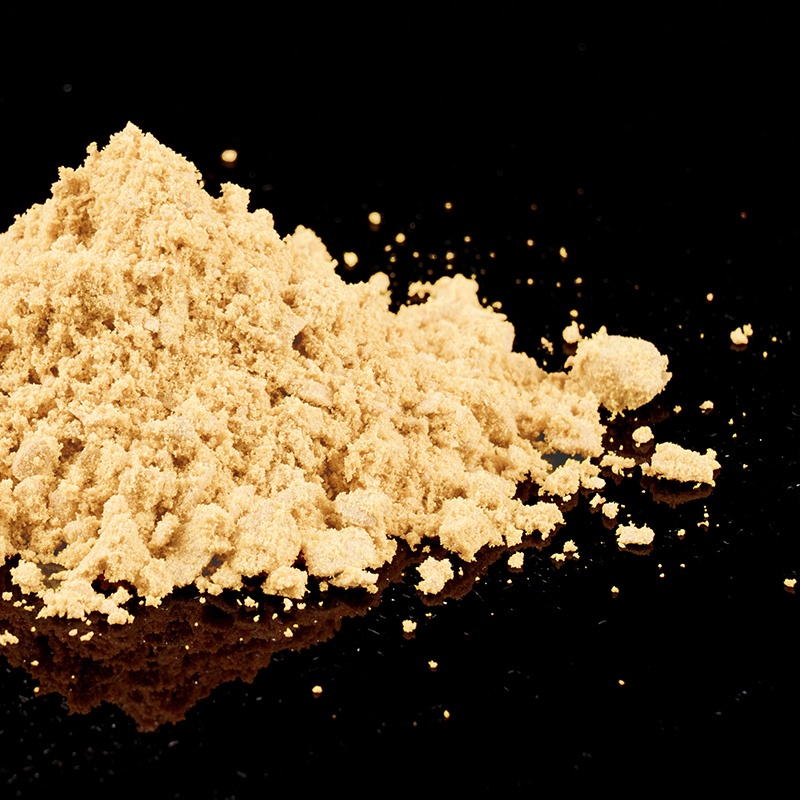
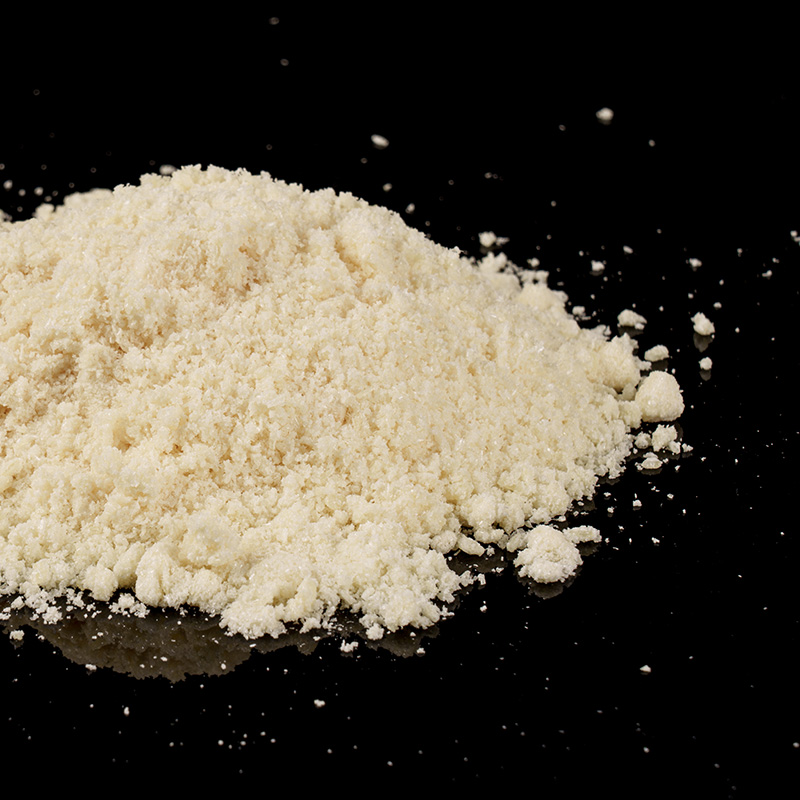
An off-white powder arrives on the bench, labelled "2,5-furandicarboxylic acid, bio-based, 98%." Before you set up a chromatography method or titrate the first drop, one question usually decides whether the rest of the analysis is worthwhile: is the carboxylic acid actually there? Ten minutes later, the FTIR spectrum has already answered. Broad, uneven absorption from 3000 to 2500 cm-1, a sharp and intense carbonyl band near 1700 cm-1, and a confident C-O stretch around 1250 cm-1. That is the whole message.
Here is the conclusion: FTIR is the fastest single way to confirm a carboxylic acid structure, and it asks only for a clean background and a careful eye. The rest of this guide explains why the three windows work, what shifts them, and where beginners go wrong.
A carboxylic acid in the liquid or solid state does not show a "clean" O-H peak. The broadness is not an artefact; it is the molecule telling you how it packs.
Every carboxylic acid, from acetic acid to a polymeric diacid in a renewable-materials pilot plant, presents the same three anchor absorptions. Learn these windows and you will recognise the functional group in almost any matrix within a minute.
The carbonyl stretch is the anchor. In condensed phases, saturated carboxylic acids typically show the C=O band between 1710 and 1720 cm-1, with the full accepted range extending from 1780 down to 1710 cm-1. Because this is one of the strongest absorptions in the spectrum, it is the first thing you look for. The O-H stretch is the broad signature that separates an acid from an ester or ketone: it appears from 3000 to 2500 cm-1, centred near 3000 cm-1, and is usually wide enough to make the whole region look "messy." The C-O stretch, between 1320 and 1210 cm-1, is the quiet third partner; it is strong, but in diacids it can split into several bands, so treat it as confirmation rather than as the primary clue.
| Assignment | Range (cm-1) | Intensity | Diagnostic value |
|---|---|---|---|
| O-H stretch | 3000-2500 | Broad, strong | Confirms the acid O-H when broad; overlaps C-H region |
| C=O stretch | 1780-1710 | Sharp, strong | Anchor band; position reveals conjugation and substituent effects |
| C-O stretch | 1320-1210 | Strong | Second reliable fingerprint; pattern can be complex in diacids |
| O-H out-of-plane bend | 950-900 | Broad, medium | Useful supporting evidence, especially in solid-state ATR |
If you only remember three numbers, make them 1710, 3000 and 1250.
Carboxylic acids hydrogen-bond to themselves. In the neat liquid or solid state, two molecules form a cyclic dimer held together by O-H···O=C bridges, and that hydrogen bonding spreads the O-H stretching vibration across a broad plateau from roughly 3000 down to 2500 cm-1. Beginners often blame the instrument; it is not failing. A broad, complicated O-H region is the textbook behaviour of a carboxylic acid, not an instrumental artefact.
Dilution in a non-polar solvent breaks the dimers and can reveal a sharper "free" O-H band near 3550 cm-1. In routine laboratory work, however, the sample is neat, a solid pellet, or an ATR crystal, so expect the broad envelope. The practical consequence is simple: do not wait for a thin, clean O-H peak in a condensed-phase acid.
Water is the most common source of confusion. Its O-H stretch covers 3500-3200 cm-1 and its bending band sits near 1640 cm-1. A spectrum with a swollen 3400 cm-1 region and a rounded 1640 cm-1 band is usually wet, not acidic. Dry the sample under vacuum or repeat the measurement with a fresh background before you assign the O-H envelope.
For aqueous samples, transmission cells have a poor reputation because water absorbs so strongly. Attenuated total reflection infrared avoids most of that trouble and has been used to record useful carbonyl and carboxylate spectra of aqueous acids down into the 700 cm-1 region, which is enough to follow protonation state changes near real time.
The carbonyl band is not fixed. Electron-withdrawing groups on the adjacent carbon raise the stretching frequency, while conjugation with a double bond or an aromatic ring lowers it. An aromatic acid, or any acid conjugated with a double bond, can therefore sit at 1685-1710 cm-1, while a saturated aliphatic acid stays closer to 1710-1720 cm-1. Always read the O-H region together with the carbonyl position before naming the class.
The sensitivity of the C=O band even reaches into acidity. In studies of substituted benzoic and acetic acid series, researchers have observed that the carbonyl stretching frequency correlates with pKa shifts, because both reflect the same electronic environment around the carboxyl group. That correlation is mostly a research tool, but it explains why small structural changes move the spectrum in repeatable ways.
For bio-based furan diacids, this matters. 2,5-Furandicarboxylic acid (FDCA) carries its two carboxyl groups on a conjugated, aromatic-like furan ring, so expect the carbonyl to appear on the lower side of the acid window, with a broadened O-H envelope. Its saturated counterpart, 2,5-tetrahydrofuran dicarboxylic acid (THFDCA), behaves more like a conventional aliphatic diacid and usually shows a carbonyl closer to the 1710-1720 cm-1 range. In both cases, the three-window logic still applies; only the exact numbers move.
If you find a strong carbonyl within about 1710 ± 20 cm-1, broad O-H structure across 2500-3000 cm-1, and a C-O band between 1320 and 1210 cm-1 in a moderately pure sample, the carboxylic acid identity is as good as confirmed. Use melting point, titration, or chromatography only when you need the exact isomer or assay value.
Certificates travel with the shipment, but materials change in storage and transit. FTIR is the cheapest insurance policy: five minutes with a clean background tells you whether the lot you are about to charge into a polycondensation reactor still looks like the acid on the certificate.
The oxidation route that converts 5-hydroxymethylfurfural (HMF) into FDCA is a good example. HMF carries a conjugated aldehyde carbonyl that appears near 1670 cm-1; the desired product, 2,5-furandicarboxylic acid, carries carboxyl carbonyls around 1700 cm-1. In a finished batch, the aldehyde band fades and the acid carbonyl dominates. When both carbonyls are visible, oxidation is incomplete or a side product - an ester, a lactone, or a partially oxidised intermediate - is present. You can read more about that conversion in our process note on FDCA manufacturing.
Esters hide in the same carbonyl window, so they deserve special attention. A simple comparison resolves most cases: an ester C=O near 1735 cm-1 with no broad O-H, an acid C=O near 1710 cm-1 with a broad O-H, and a carboxylate salt with no neutral C=O at all but strong bands near 1600-1550 and 1420-1300 cm-1.
| Species | Typical C=O region (cm-1) | O-H / N-H behaviour |
|---|---|---|
| Saturated carboxylic acid | 1710-1720 | Broad O-H 3000-2500 |
| Conjugated / aromatic acid | 1685-1710 | Broad O-H 3000-2500 |
| Ester | 1730-1750 | No broad O-H; C-O bands near 1250-1100 |
| Ketone | 1705-1725 | No O-H |
| Aldehyde | 1720-1735 | C-H doublet near 2820 and 2720 |
| Carboxylate salt | No neutral C=O near 1710; COO- at 1600-1550 and 1420-1300 | No broad 3000-2500 O-H |
The hydrogenated analogue of FDCA, 2,5-tetrahydrofuran dicarboxylic acid (THFDCA), sits at the other end of the flexibility spectrum. Because the ring is saturated, its spectrum resembles that of a conventional aliphatic diacid; the carbonyl band is higher and sharper, and the O-H envelope is closer to the classic 3000-2500 cm-1 textbook picture. The sample-handling advice is identical: keep water out, keep the background clean, and judge the carbonyl and O-H regions together.
The best interpretation habit is a fixed sequence. Follow the same five steps every time and you will catch subtle problems before they cost a wrong batch release.
Aromatic diacids such as FDCA can decarboxylate if you grind a KBr pellet too aggressively or heat samples above roughly 200°C. The spectrum then shows a weakened carbonyl and reduced acid character, sometimes with new carbonate-type bands. If the result looks "wrong," prepare a fresh sample at room temperature instead of forcing an assignment on material that has changed.
FTIR will never replace a titration for an exact assay, and it will not tell you which regioisomer you are holding. But for the first ten minutes of any carboxylic acid question - especially with bio-based monomers where a certificate does not always tell the whole truth - it remains the fastest, cheapest, and most decisive single measurement available. Learn the three windows, respect the broad O-H, keep water out, and the spectrum will return the favour every time.

Copyright© Zhejiang Sugar Energy Technology Co., Ltd. All Rights Reserved.
 Custom Biobased Polymer Manufacturers
 英语
英语 中文简体
中文简体